A question most traders ask at some point is “What indicators are best for Day Trading?” It doesn’t matter if you’re a beginner or an experienced trader, with tens of thousands of “indicators” out there, it’s a perfectly good question. You could easily spend a lifetime evaluating each one during your trading adventures. Are some indicators better than others at helping identify market trends? Is there a “Holy Grail” indicator? Where do you even start?
Before we get too deep on the subject, let’s back up and discuss what indicators are and their place in a successful trading approach. Then we’ll show you a real-world, $22k example and list the best stock indicators for day trading we use most at Limitless Volume.
Want to succeed and avoid failure as a trader? Let Limitless Volume be your mentor for success! Get a FREE trial membership… no credit card required… get immediate access. Just choose your track:
How Do Stock Indicators Work?
The famous astronomer and astrophysicist Carl Sagan once said, “You have to know the past to understand the present.” While he may have been talking about more “cosmic” phenomena – and we don’t know whether he ever traded a stock in his life — it’s actually a pretty good way to introduce the subject of stock indicators!
Indicators are useful metrics that help us determine when a stock might be continuing a trend, running out of gas, or getting ready to pivot. They provide this help by looking at historical factors such as price, volume, and other numerical stock characteristics through the lens of a mathematical formula or decision-making process (heuristic).

Indicators DON’T tell the future – nothing can! But they CAN give us an edge in making an educated guess as to which way things will go from this point in time – especially when you use an indicator in combination with other forms of analysis like Candlesticks. (This is the combination of techniques Limitless Volume uses, and it has been very successful.)
So, from the start, it’s important to know that the most any indicator can do is give you a particular view of the past as just one way to understand where things stand in the present, to give you an edge in guessing where things might go in the future. We emphasize “just one way” because the present is actually far more complicated than any one formula or graphic can summarize. And as for the future, well, that’s always up for grabs!
Just pick any event in your everyday life. It doesn’t take much thought to understand how an infinite number of other event paths came together to make this one moment happen. It’s like the “Butterfly Effect” where a butterfly flaps its wings on one side of the globe and that triggers a string of events that ultimately leads to a hurricane forming on the other side. In the case of the stock market, the primary influence is human emotion and decisions which are often inefficient and irrational – and there is an almost endless supply of that to shape the state of the market at this very moment.
What an indicator helps us do is trace back to the possible reasons why a stock’s price, volume etc. is where it is now – like tracing the series of events back from the hurricane to the butterfly. That way we can identify patterns that tell us which way things are more likely to go from here, based on what we saw happen in the past.
Going back to our Carl Sagan quote, the real question isn’t how we can see into the future, but instead how we can get the best possible read on the present. And one activity where it’s REALLY important to know what’s going on NOW is Day Trading!
How To Use Stock Indicators
Let’s face it – many traders get “indicator crazy”, on some endless quest for the Holy Grail indicator or the perfect combination of indicators. Entire trading “systems” are built around “the latest, greatest indicator” and traders sadly pay lots of money to get access to one of these magical formulas only to find it eventually fails, the trader loses a bundle of money, and then it’s on to the next one!
But the fact is, there is no “Holy Grail” indicator. There is no indicator or combination of indicators that is 100% accurate in helping identify patterns to predict future movements. Indicators have their place in a successful stock trading approach, but they’re just one part of it.
The best a trader can do is identify an edge that gives a high probability of winning — and then be disciplined to trading the edge. Think like a casino. Even though the odds are in the casino’s favor the highest percentage of the time, they won’t win every hand. But the casino doesn’t change its approach with each loss. Consistency wins the day since the big picture favors the casino.
At Limitless Volume, instead of selling traders on a particular “indicator” or set of indicators, our training focuses on spotting trading opportunities that give the highest edge using a combination of Candlestick analysis, price movement and a selection of indicators. Indicators are then used to help manage a trade by giving us indications of when to stay in a trade, when to take profits, and when to exit a trade.
Something essential to understand about indicators is they are lagging. This means none of them, or at least very few, represent data in real time. The only piece of information that is real time is the current candle and price. So, the Limitless Volume “philosophy” is about using a combination of techniques to find that edge with the best read on the present – using the best indicator around: your own brain.
We don’t just teach Day Trading and Options Trading… we mentor you. Get a FREE trial membership and see why our Limitless Volume traders succeed!
What’s The Most Powerful Stock Indicator?
Technical analysis, indicators, candlesticks – all of this is important to clearly understand. But equally important (if not more important) is having the right mindset to stay “in the present” and not get distracted by emotion. This is not to say you should “leave your emotions at the door.” It’s truly impossible to divorce yourself from your emotions and you shouldn’t even fool yourself into thinking you can. Instead, if you can discipline your brain – the ultimate indicator — to stop reacting in line with unprofitable, entrenched behavioral patterns, then you’ll succeed like the casino.

There is a part of the brain that is responsible for the “fight or flight” response and our learned behavior – the “limbic system”. On the one hand, this part of your brain is critical for your survival. But it can actually work against you as a trader. Why? Because this part of the brain puts more emphasis on identifying dangers than on identifying positive opportunities. After all, it’s those dangers that are a risk to your survival, not the positive opportunities. And this part of the brain doesn’t distinguish between psychological stress and biological threat – it’s all the same.
Picture yourself hiking up a mountain in search of gold that’s said to be in the rock. Along your path, there’s a cliff to your left and some bushes to your right. Out of nowhere, a snake slithers out in front of you from the bushes. Most people would turn around and run in the other direction before examining what type of snake it is. And if you turned and ran, you’d also fail to notice the vein of gold running through the cliff to the left.
What happens from this point is also important. Having escaped from the (possibly?) deadly snake, your brain gives you a nice shot of dopamine and endorphin as a reward for avoiding mortal hazard. This helps entrench that behavior into your decision-making process. And then the next time a snake slithers out in front of you, it will be even easier for your brain to make the same decision – to run in the opposite direction instead of examining whether there really is a threat (and getting that gold)!
Essentially what’s happened is your brain traded the opportunity to get rich for the safe and sure reward of dopamine and endorphins!
Now, what if you did some homework before taking your hike and learned that the worst kind of snake you could encounter in that area will rarely act aggressively to humans and might bite but isn’t at all venomous. Sure, nobody wants to get bitten, but knowing this in advance might take the “flight” out of “fight or flight” and could seriously change the outcome of your adventure.
The moral of the story? Your best indicator for Day Trading is your brain and one way to take some control over it is with a plan.
If you have an exit plan and know your risk tolerance going into a trade, then you can execute the trade without fear. For example, if you know you can afford to lose $4 per share on a trade, then you’ll set your stops accordingly… and if you know what level of profit you’re happy with, you won’t be tempted to “let it ride” and wipe out your profits before you have a chance to get out.
A Real World $22,000 Example
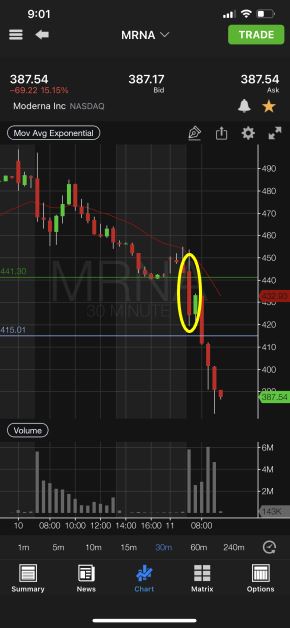
On August 8, 2021, Limitless Volume founder and head trader Daryl Morse identified an opportunity with Moderna Inc. (NASDAQ: MRNA). He left a simple message on the Discord chat shared by Limitless Volume members, “MRNA setting up for a put position.” And just three days later, that materialized into a nearly $22,000 gain. How?
In the three weeks prior, the stock had jumped from $230 to $491. One common indicator, the Average True Range (ATR) showed that the stock was extending upward at a whopping three times the average daily rate. This means there is high probability the stock is going to come back to the 21 Day Exponential Moving Average (21 EMA) – another important indicator – which was reading $365 at the time.

So, with the ATR being 3x higher than average and the stock price ($491) being so far above the 21 EMA ($365), there was a strong likelihood the stock price was going to come down. And just three days later, on August 11, 2021, it did. When Daryl saw the price drop below the previous day’s closing price, and there was a good level of volume in trading, it was time to make the move.
A combination of factors made this a logically good trade:
- Uncommonly high ATR
- Stock price was well above the 21 EMA, but failed to hold and at the point of entry ($446) had just dropped below the 21 EMA
- Price breaking previous day’s close
- QQQ, SPY, AMZN and TSLA were all not holding the previous day’s close – a strong indication that the market could be heading down on this day
- Strong volume activity in MRNA at market open
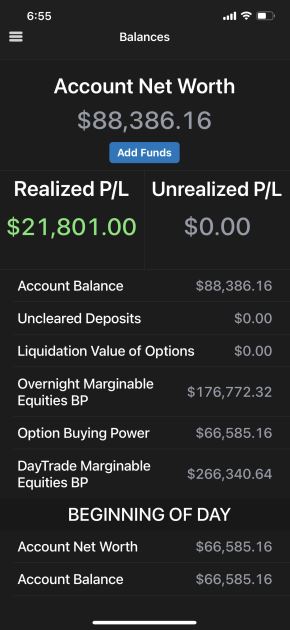
What was the “plan”? How much risk was Daryl comfortable taking? Where did he feel was a good place to exit the trade? Before going into the trade, Daryl determined his position size and risk tolerance based on his account size going into the trade: $4,500 at risk, 15 option contracts to purchase.
The result? A $21,801 gain in a couple hours. Risking $4,500 to produce a gain of $21,801 is a great risk-return ratio by any standards. And by the end of the day, the stock price was close to the 21 EMA – exactly where it was expected to drop toward.
But what if there was hesitation in jumping in? What if the “fight or flight” mechanism said, “This is too dangerous… wait and see what happens”? This fast-moving opportunity would be missed completely. Stocks usually drop much faster than they rise. Why? Everyone else’s “fight or flight” mechanism telling them to “sell, sell, SELL!” What becomes a “danger” for the masses can be a positive opportunity for the expert trader.
This particular trade is part of a string of successful trades in August 2021 where you can see how Daryl grows a $28k account to $98k in just 9 days. Want to see other trades like this? Take a look at this blog article detailing the 9 days of successful trading to earn over $70k.
All great successes have a great mentor. Get a FREE trial membership and see for yourself why our members are so successful…
What Indicators Are Used Most Often?
Here is a quick breakdown of some of the specific indicators Limitless Volume uses in Day Trading (in combination with Candlestick analysis and a close eye on price movement).
Moving Averages
Moving averages are some of the most important indicators you will ever use. In fact, it is very rare to see any technical trader in the market not using them. The general principle of a moving average is that it helps to filter out all the background noise in the stock and tell us where the average price is per a selected period of time. This is done by taking a specified number of previously completed candles, averaging their prices together and thus plotting a line on the chart graphically that represents the average price.

There are two types of moving averages: Simple Moving Averages (SMA) and Exponential Moving Averages (EMA). SMA is calculated the same way you would find the average of a set of data – just add the values of the candles in the time range and divide by the number of candles. EMA is very similar but gives more weight to the most recent candle values. This results in a line that will typically move faster in response to more recent price changes than the SMA line.
Between the two types of moving averages, at Limitless Volume we use the following:
- On ALL time frame charts
- 11 EMA
- 21 EMA
- 50 SMA
- On time frame charts 15 minutes or higher
- 200 SMA
With this moving average data, we can identify likely trends upward or downward. Exactly what we do is beyond the scope this article – but you can learn more as a Limitless Volume MAX Volume member!
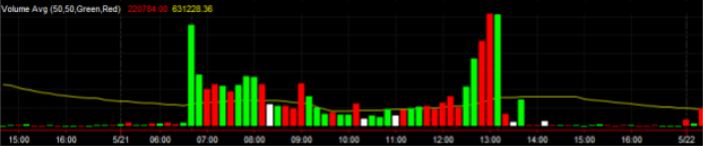
Volume Average
The volume average indicator is an easy way to determine the amount of trading volume in a stock. A stock is said to have “good” volume when the current volume is above the average line.
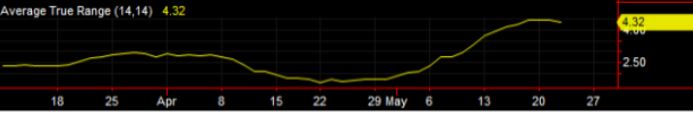
Average True Range (ATR)
The average true range measures the average candlestick move over the last 14 candles. This is a great tool at telling us how far we can reasonably expect a stock to move each day. Use this indicator on a daily chart.
Keltner Channel
A Keltner Channel is a great way to find stocks that are in an overbought or oversold state. We primarily look at this indicator on a daily chart to help us determine when a stock might be pivoting into a moving average pullback or a pivot back into the original direction the stock was headed after a pullback has been completed.
A Keltner Channel shows the Average True Range (ATR,) graphically on top of a chart. It plots a standard line to follow in the middle, in our case this is a 21 moving average, and then draws a line 1 Average True Range above and below the middle line which is also known as the “means.” We repeat this process for 2 and 3 ATRs away from the means as well. In the image below you can see that the means is the yellow line with the positive ATRs in the cyan color along with the negative ATRs in magenta.
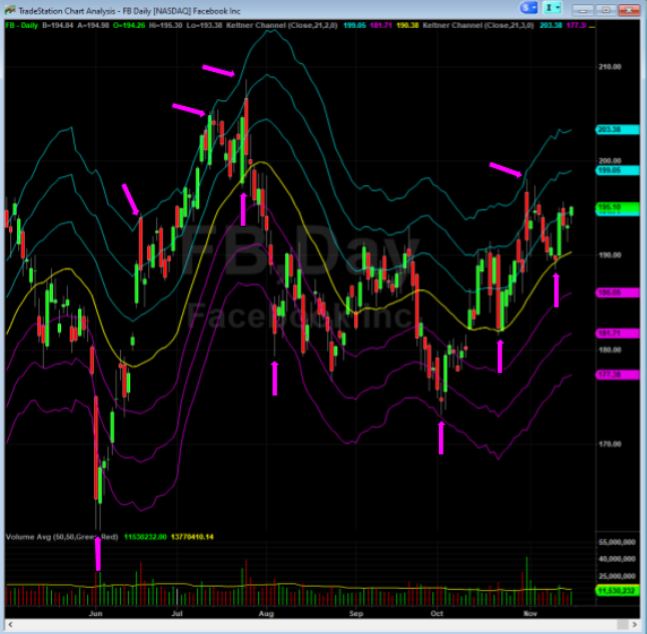
The probability that a stock continues past its 3 ATR line above or below is statistically very unlikely. Stocks become very overbought or oversold in these ranges and almost always need to have some degree of pull back before they can resume moving in the current direction. The arrows in Figure 3.10 show when the stock hits its 3 ATR levels and the stock makes a reversal. There are also a few arrows on the means showing how the stock usually continues back in the original direction after it pulls back to the means.
$TICK
The $TICK is one of the most powerful market internals that we use. It measures how many stocks in the entire New York Stock Exchange are downticking vs. upticking.
A tick, in reference to the stock market, means anytime that a stock makes the minimum amount of price movement possible. In most cases this would be 1 cent. So, if you were looking at the tick chart and it had a reading of 0, this would mean that half of the stock market is moving up and half is moving down. In other words, we are neutral in direction. If the reading shows -500 this would mean there are 500 more stocks downticking than upticking and at that time, we have more of an overall bearish flow to the market.
The values used for the tick are 0, +500, +1000, -500, -1000. There is also a 5 EMA on the tick as well. The above tick chart values only work for intraday trading, and you always want it set on a 5-minute chart.
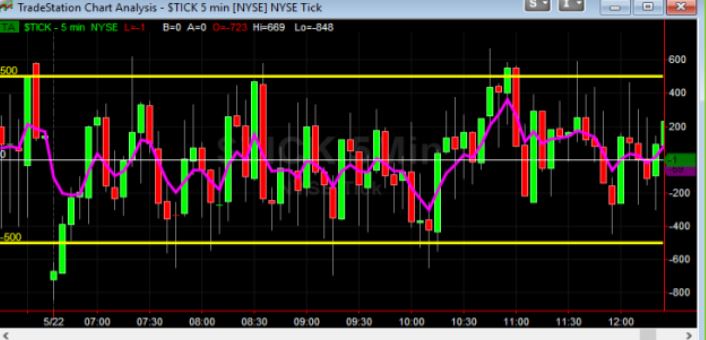
Any time the tick is between +500 and -500, this is considered to be white noise and the market does not have a huge preference in either direction. However, when we start to see candles pass by these ranges, that is when we know there is a lot of pressure in that direction. For example, if the tick was holding above 0 for an extended period of time and consistently trending higher above the 500 range, we know there is a very large amount of upward pressure. The same would be true for the downside.
In cases where the tick hits the +1000 and -1000 levels, these are considered extreme. In these cases, a market reversal may be close, so you might consider taking some profit or getting ready exiting your position.
Fibonacci Lines (Fibs)
Fibonacci lines are derived from the Fibonacci pattern that is the basis for how most of nature forms. It just so happens that these numbers can be directly applied to the market to help predict where stocks are going to pause and pivot. Usually this is best for identifying possible reversal areas on a daily chart but can effectively be applied to intraday trading. Usually, we are most concerned with the 50% point on an intraday level.
The numbers we use for the fib are as follows: 0%, 23.6%, 38.2%, 50%, 61.8%, 78.6%, 100%, 127.2%, 161.8%, 261.8%, 423.6%.
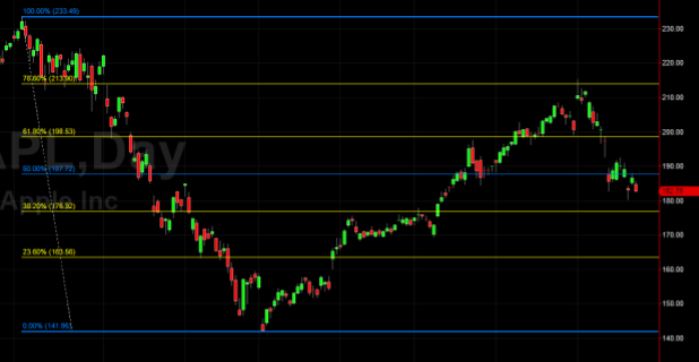
Fibonacci Lines are drawn from the bottom of a trend to the top. Any line in between these two points is considered a place where the stock could either pivot or consolidate before continuing the trend.
In the image above you can see how after the run in SPY we had a reversal right back down to the 50% mark (the blue line in the middle). It bounced right at this level and ran back up for nearly a dollar before then hitting the 78.6% level again and continuing its downtrend.
The Bottom Line
While there is no “Holy Grail”, indicators are powerful tools for identifying trends and understanding historical movements, but they must be used in combination with a disciplined approach to trading. Just a handful of useful indicators, used the right way, are enough to give the trader everything he/she needs to win. But the expert trader understands that technical indicators can only help identify opportunities; ultimately, the most powerful indicator is the human brain which can easily prevent even the most logical trades from ever taking place if there is fear involved. Understanding the role emotions play in trading – and controlling those emotions with a risk-management plan – are even more important factors to success than any indicator.